How I Geolocated and Visualized Internet Requests Hitting My Publicly Available Sites for HomeLab
Currently, when engineering and implementing centralized logging system, I realized that the need for IP-based geolocation and visualization was really essential. By correlating this information with log fields, I would be able to do further security analyses(determine anomalous patterns), traffic optimization, or even do some analyses relating to business(who visited our sites the most and what their countries are?),… Therefore, I needed a technique that is somehow capable of geolocating and visualizing the requests containing public IPs. At first, there was such confusion about where I should get started. Thankfully, after having the basic foundation of ELK and searching for solutions, I found a blog series that was the fundamental and gave me the starting points that I derived from. The series I found can be found here: Setting Up Kibana Dashboards for NGINX Log Data.
Integrating the Solution into My Existing Infrastructure
The setup in the blog is quite similar to my existing infrastructure setup, except that I’ve been using Ingress NGINX as the entry point for my container orchestration platform. You can imagine my infrastructure as below:
To reach our goals, I need the following 4 components:
- Beat - agent to collect logs for each service
- Logstash - parsing log into json format and/or applying filters
- Elasticsearch - to ingest collected logs
- Grafana/Kibana - visualization
Once I completed the engineering of those components, the diagram would look like:
How did I track the Public requests?
As I’m using cloudflare technology for hosting, by tunneling from cloudflare edge to the cloudfared agent hosting on my own infrastucture, it plays a role of reverse proxy in building and forward traffic from external network to internal one. There’s a useful non-standard http header that allows us to track the public IP of the client, that’s CF-Connecting-IP. According to Cloudflare’s documentation
CF-Connecting-IP provides the client IP address connecting to Cloudflare to the origin web server. This header will only be sent on the traffic from Cloudflare's edge to your origin web server.
This means that Cloudflare will intercept every request coming from internet, open up the packet and append the CF-Connecting-IP header with the client’s original public IP (except VPN connected) and then the modified packet will traverse to the Ingress. This could be seen as a key factor for me to pivot on.
To track that wanted IP, I simply logged that HTTP header by adjusting the Configmap in Ingress Chart. NGINX allows us to access incoming HTTP headers in its configuration using the prefix http_. In this context, I simply needed to add “http_cf_connecting_ip”: “$http_cf_connecting_ip” to the json object.
For example
  config: {
    use-proxy-protocol: 'true',
    log-format-escape-json: 'true',
    log-format-upstream: '{"time": "$time_iso8601", "remote_addr": "$remote_addr", "x_forwarded_for": "$proxy_add_x_forwarded_for", "request_id": "$req_id",
    "remote_user": "$remote_user", "bytes_sent": "$bytes_sent", "body_bytes_sent": "$body_bytes_sent" , "request_time": "$request_time", "status": "$status", "vhost": "$host", "request_proto": "$server_protocol",
    "path": "$uri", "request_query": "$args", "request_length": "$request_length", "request_time": $request_time,"method": "$request_method", "http_referrer": "$http_referer",
    "http_user_agent": "$http_user_agent", "http_cf_connecting_ip": "$http_cf_connecting_ip",
    "proxy_upstream_name": "$proxy_upstream_name", "proxy_alternative_upstream_name": "$proxy_alternative_upstream_name", "upstream_addr": "$upstream_addr", "upstream_response_length": "$upstream_response_length", "upstream_response_time": "$upstream_response_time", "upstream_status": "$upstream_status" }'
  }
Original flow for log processing:
- Filebeat
- Collected logs from Ingress controller pods and sent them to Logstash.
- Logstash
- Configured to perform the following tasks:
- Parse logs into JSON format.
- Classify logs based on patterns.
- Label logs according to the classified logs.
- Route logs to respective log streams in Elasticsearch based on the labels.
- Configured to perform the following tasks:
- Elasticsearch
- Used the GeoIP processor to enrich documents containing public IPs from the http_cf_connecting_ip field.
- Stored log documents.
This flow worked for me for a while until I found that sometimes the requests resulted in inaccurate geolocation. The reason for that was that the GeoIP processor relied on GeoLite2-City.mmdb database, which is a free version and sometimes introduced the inaccuracies.
Transition to New Enrichment Setup
It took me a whole day to research ELK ecosystem and finally I ended up with the migration from GeoIP processor to external API call for log enrichment. To achieve that, I leveraged a logstash filter plugin called http, which allows me to call an external API and use the results to enrich the documents before ingesting them to elasticsearch.
IPinfo
I decided to use IPinfo as an external API for IP-based log enrichment. The json object of the results is almost identical to previous setup, the fields needed for geolocation and visualization are available.
Example json object result of IP 8.8.4.4
{
  "hostname": "dns.google",
  "city": "Mountain View",
  "region": "California",
  "country": "US",
  "loc": "37.4056,-122.0775",
  "postal": "94043",
  "timezone": "America/Los_Angeles"
}
However, due to it’s rate limiting per month(50k requests/month), it’s possible that I could exceed that limit and end up in receiving 429 error code. Additionally, the behaviour of logstash is that it will simultaneously make requests to external API when it’s notified of multiple log lines, which can lead to unnecessary API calls — especially when multiple requests originate from the same client (e.g., subsequent requests for static files).
To resolve that possible outage in combination with the fact that the IP assigned to a city/residence would change but not frequently, I implemented a solution to optimize API usage
IPlookup
- This is an API written in Flask framework and acting as middleware. It’s designed and implemented to perform several functions:
- Receive field containing IP from logstash
- Check if the received IP was cached already
- If yes, immediately return the cached data to logstash
- If not, make an API call to IPinfo to get the data of received IP, then store the received data in cache for configured period to reduce amount of API calls to IPinfo
- Handle race condition when writing to cache for each IP being processed
- Handle simultaneous requests
- Considering all requests hitting the site at the given time as a batch(request for ‘/’ and subsequent requests for static files..). Only one request in each batch will be allowed to write to cache. Others will have to wait for that writing to be complete to read and return the cached data to logstash.
After restructuring and transitioning, the diagram looks like
In the diagram above, I drew the direct connection from logstash to IPLookup for simplicity. In fact, to establish the connection, it has to traverse the Ingress Nginx - as an only entry point for container orchestration platform.
The working flow after restructuring would be:
- Filebeat
- Collected logs from Ingress controller pods and sent them to Logstash.
- Logstash
- Configured to perform the following tasks:
- Parse logs into JSON format.
- Classify logs based on patterns.
- Label logs according to the classified logs.
- Call IPlookup if document’s http_cf_connecting_ip field is not blank and and get the enriched data
- Route logs to respective log streams in Elasticsearch based on the labels.
- Configured to perform the following tasks:
- Elasticsearch
- Stored log documents.
Installations
Beat Installation(filebeat)
Use autodiscover to enable dynamic targeting of pods, as pods in k8s environment are ephemeral.
References:
Example of configuration:
  filebeat.yml: |-
    filebeat.autodiscover:
      providers:
        - type: kubernetes
          # For simplicity, I only target resource from ingress-nginx namespace at the moment
          namespace: ingress-nginx
          hints.enabled: true
          templates:
            - condition:
                contains:
                  kubernetes.namespace: ingress-nginx
              config:
                - type: container
                  fields:
                    type: ingress
                  paths:
                    - "/var/log/containers/*-${data.kubernetes.container.id}.log"
    output.logstash:
      hosts: ["logstashhost:port"]
      # Additional settings
Logstash Configuration
Here is the pipeline I configured for ingress-nginx
input {
    beats {
        port => 5044
        add_field => { "pipeline_source" => "ingress-nginx" }
    }
}

filter {
    if [pipeline_source] == "ingress-nginx" {
        if [message] =~ "\A\{.+\}\z" {
            json {
                source => "message"
            }
            mutate {
                add_tag => ["access_log"]
            }
            if [http_cf_connecting_ip] and [http_cf_connecting_ip] != "" {
                http {
                    # Ingress-exposed API for IPLookup App
                    url => "https://iplookup.internal.locthp.com/lookup"
                    verb => "POST"
                    headers => {
                        "Content-Type" => "application/json"
                    }
                    body => {
                        "ip" => "%{http_cf_connecting_ip}"
                    }
                    body_format => "json"
                    # The field in which will store enriched data
                    target_body => "geoip"
                }
            }
        } else {
            grok {
                match => {
                    "message" => [
                        "(?<time>%{YEAR}[/-]%{MONTHNUM}[/-]%{MONTHDAY} %{HOUR}:%{MINUTE}:%{SECOND}) \[%{LOGLEVEL:level}\] %{NUMBER:pid}#%{NUMBER}: \*%{NUMBER:request_id} %{GREEDYDATA:error_message}"
                    ]
                }
            }
            if [level] and [error_message] and [pid] {
                mutate {
                    add_tag => ["error_log"]
                }
            }
        }
    }
}

output {
    if [pipeline_source] == "ingress-nginx" {
        if "access_log" in [tags] {
            elasticsearch {
                hosts => ["https://127.0.0.1:9200"]
                index => "ingress-nginx-controller-access-logs-%{+YYYY.MM.dd}"
                user => "secret"
                password => "secret"
                ssl => true
                cacert => "/path-to-http_ca-cert/http_ca.crt"
            }
            stdout {
                codec => rubydebug
            }
        }
        if "error_log" in [tags] {
            elasticsearch {
                hosts => ["https://127.0.0.1:9200"]
                index => "ingress-nginx-controller-error-logs-%{+YYYY.MM.dd}"
                user => "secret"
                password => "secret"
                ssl => true
                cacert => "/path-to-http_ca-cert/http_ca.crt"
            }
            stdout {
                codec => rubydebug
            }
        }
    }
}
Visualization (Kibana/Grafana)
Okay, almost done. Since I reside in Vietnam, let me query the countries of visitors who are not from Vietnam
 From the returned documents above, we can see that on Jan 02 2025, we had 2 different countries visited our site. One came from Finland with the IPv4 of 185.77.218.10 and another came from US with the IPv6 2a09:bac5:d42e:e6::17:26a
To be able to visualize geolocated data, I need to convert geoip.location to geo_point data type. To do this, create a mapping for index template
{
  "properties": {
    "geoip": {
      "properties": {
        "location": {
          "type": "geo_point"
        }
      }
    }
  }
}
Kibana
I’m now able to use MAP to visualize where the requests came from based on geoip.location field
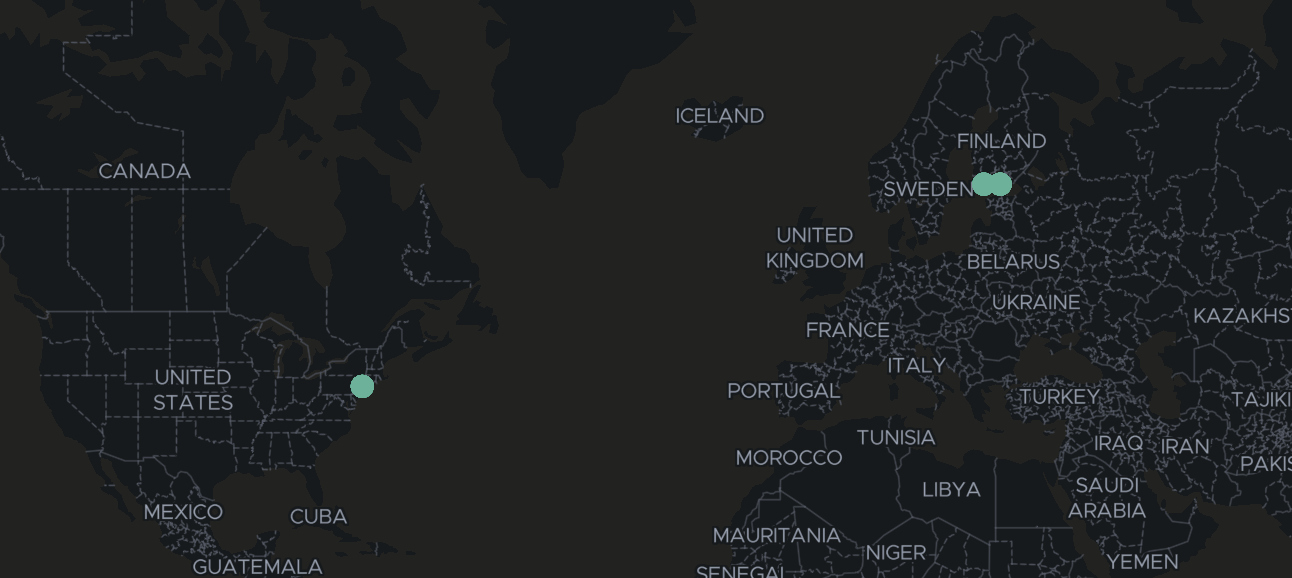
The map worked as expected display requests came from Finland and US as mentioned above
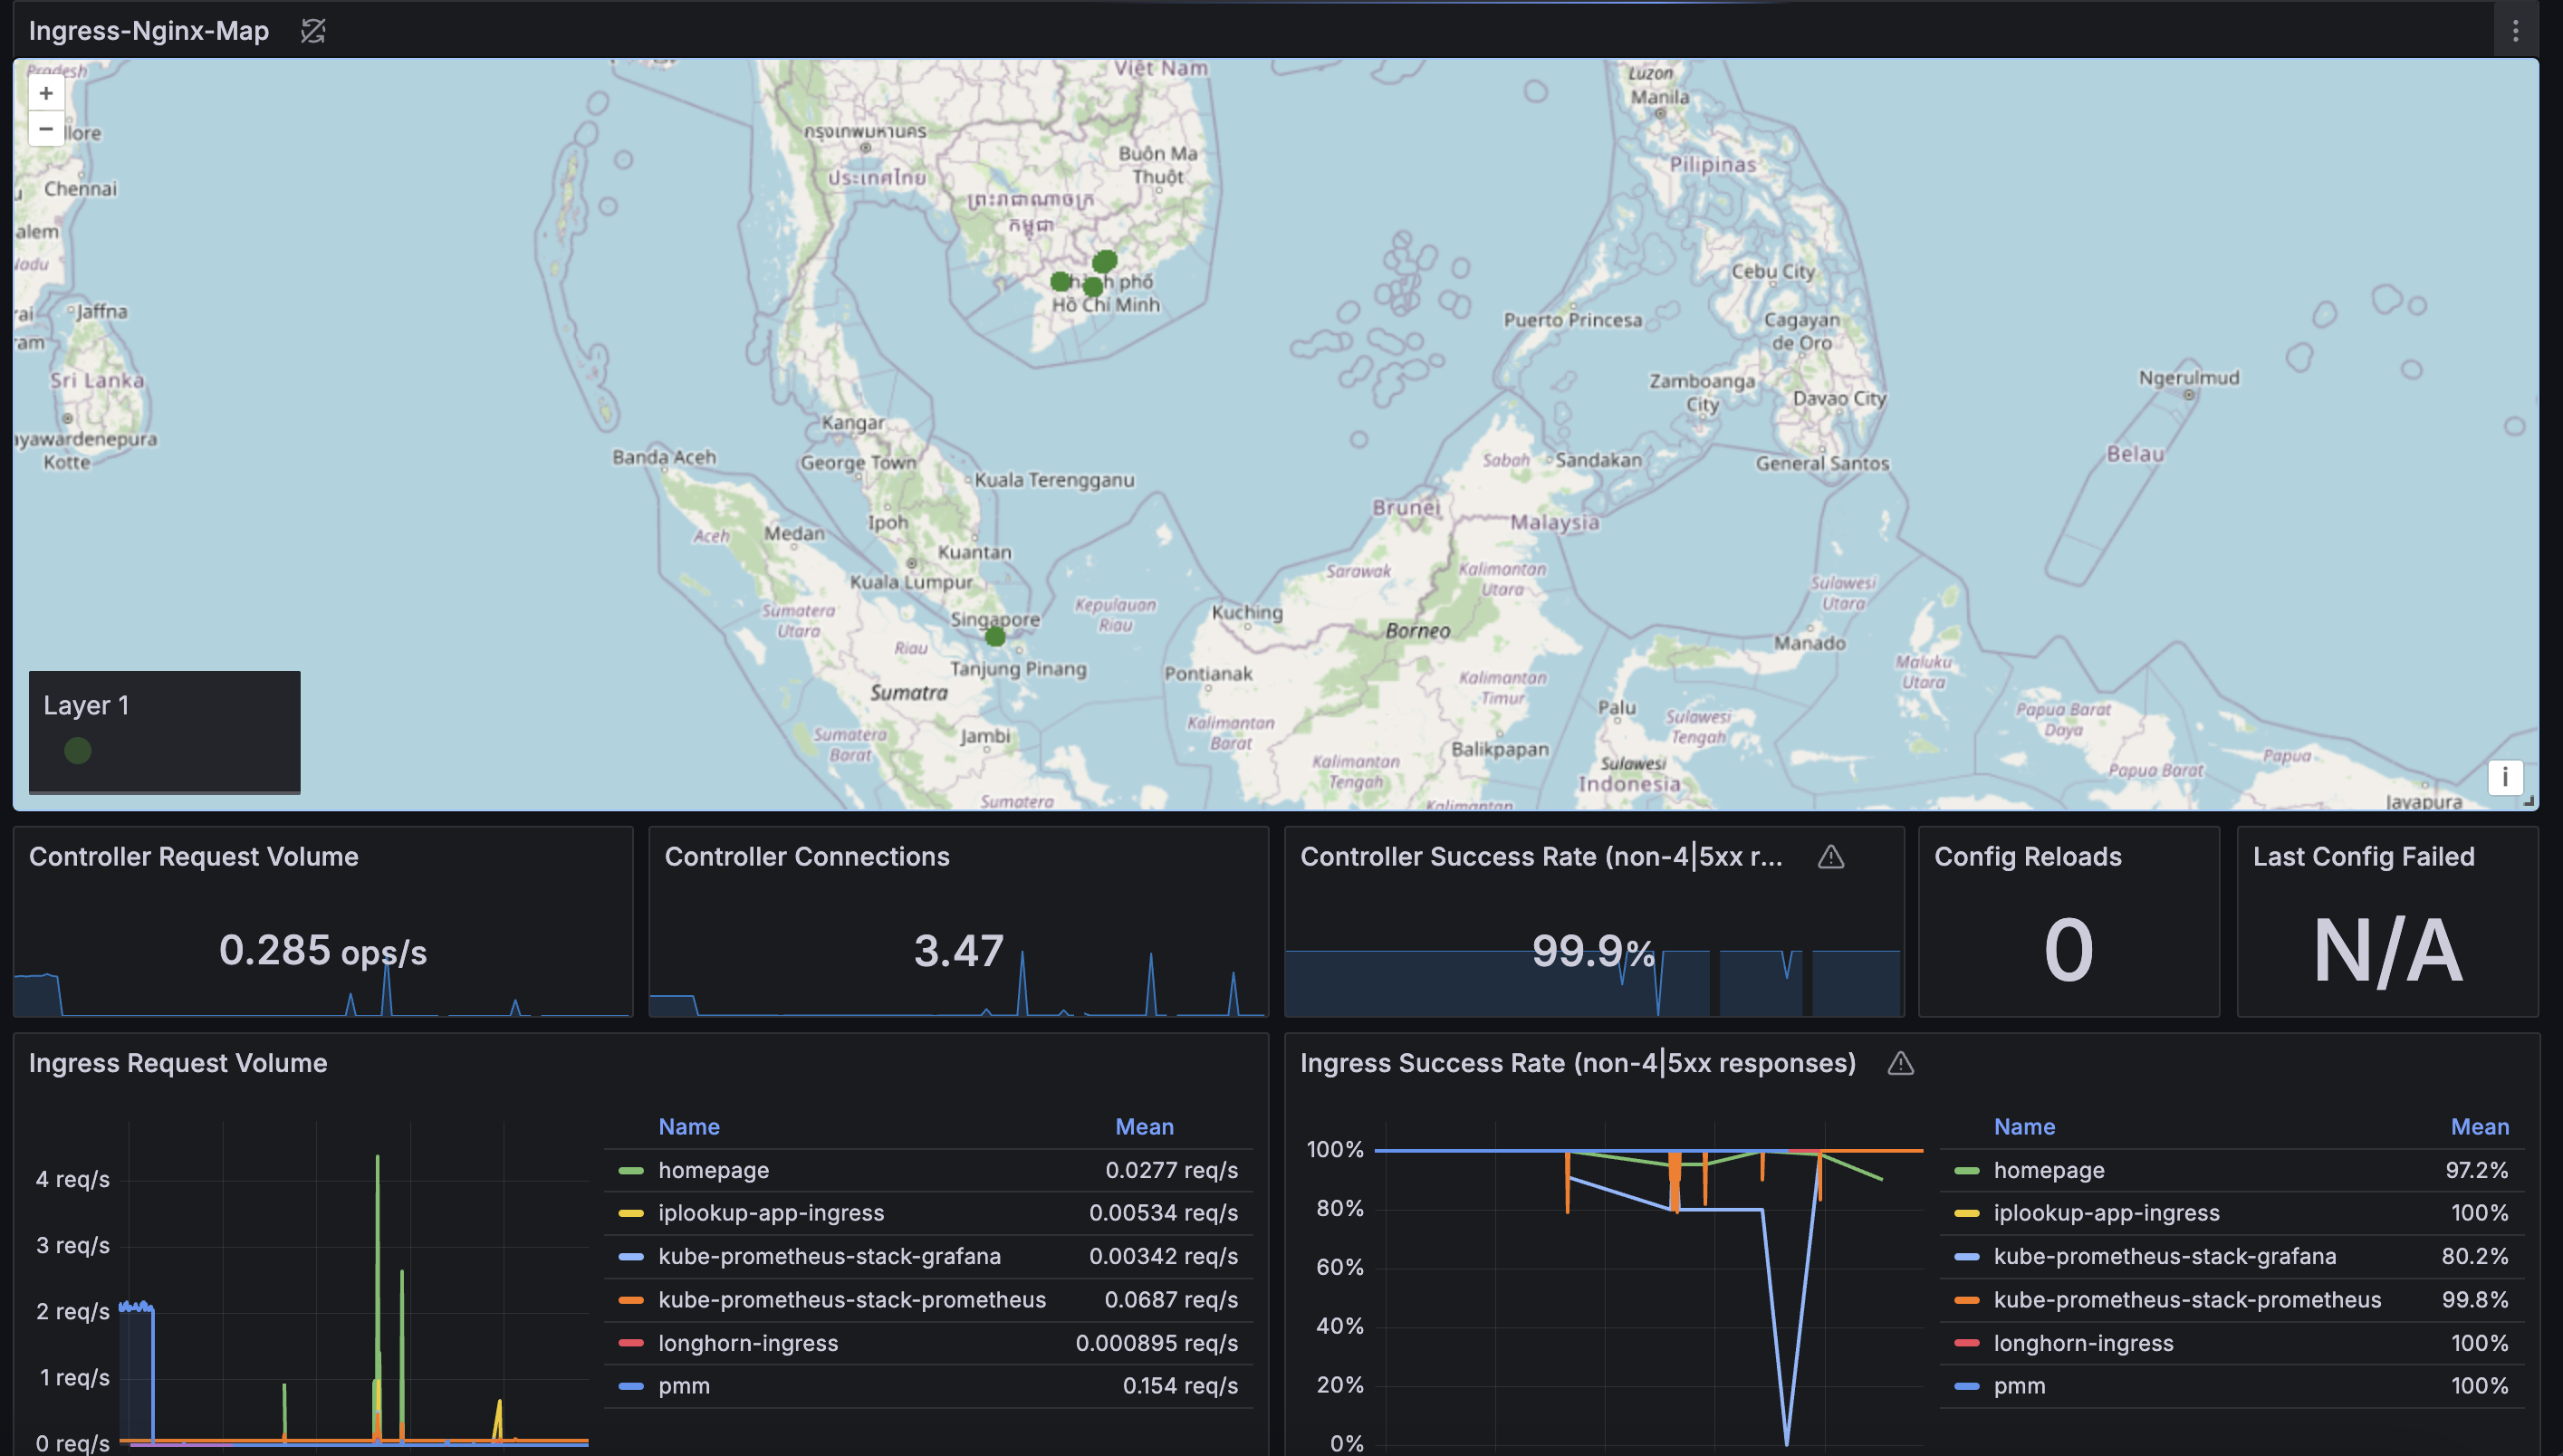
Grafana
I’m also able to use this method in addition to Grafana-prebuilt dashboard of Ingress Nginx to enrich insights
Conclusion
In this blog, we’ve explored how to geolocate and visualize internet requests hitting publicly available sites, particularly in a HomeLab environment. By leveraging tools like ipinfo, Flask API, and Grafana, we were able to effectively collect, process, and visualize geolocation data of visitors in real-time. This approach not only helps in understanding traffic patterns but also enhances security by providing insights into the geographical distribution of visitors.
Although tracking the public IP is straightforward using the Cloudflare-provided dashboard, building this solution was both useful and an enjoyable learning experience. It not only deepened my understanding of the underlying processes but also helped me with an opportunity to create a tailored approach that aligns with specific needs. Additionally, there are several areas for improvement, such as optimizing the efficiency of the traffic handling and adding more granular logging. One potential enhancement could be tracking whether the IP is connected via VPN, which would provide more accurate insights into traffic sources. This solution can be continuously developed, incorporating additional features like automated alerts or advanced traffic analytics, to further enhance its functionality and robustness
If you’re interested in exploring further, consider integrating this system with more complex visualization tools, or expanding the data collection to include other types of requests and behaviors. Geolocation visualization is just the beginning of what can be achieved with a well-set-up monitoring stack!